I spent an afternoon measuring Foundry and Hardhat on one small Solidity project, and the number I could have published moved further than the difference between the tools.
Taken back to back, forge build with nothing to rebuild ran 1.09x faster than hardhat build. With a one-second pause inserted before every sample, the same comparison read 1.06x, and thirty samples per side put the bottom of its interval within half a percent of a tie. A third comparison — two Foundry releases, same repository, same command — reported 1.50x or 3.13x depending on whether the two releases shared an output directory.
None of those numbers is a mistake. Each one is what the command actually took, on this machine, under that setup. That is the problem with benchmarking developer tools: the measurement is cheap, the tools are fast, and the setup decides the answer.
So this article is not another Foundry versus Hardhat comparison. I already published one of those. It is the same harness turned around to measure the method: what each methodological control is worth, in milliseconds and in wrong answers, and what you have to publish for someone else to get your number back.
The workload, in full
One generated Solidity project that both toolchains compile and test directly: 40 inheriting contracts, a small vault, and 120 Solidity unit tests, for 42 compilation units.
Both tools were given the same native solc 0.8.25 binary (BENCH_SOLC_PATH, SHA-256 cc3f94a7…), the optimizer enabled with 200 runs, the Cancun EVM target, and isolated test execution. The releases under test were Foundry 1.5.1 (the version on my PATH), Foundry 1.8.3 (extracted from the release tarball into /tmp, so my toolchain was untouched), Hardhat 3.12.0 and Node.js 22.17.0. The machine was an Apple M3 Pro with 12 logical CPUs and 36 GB of memory, running macOS 26.5.1 (Darwin kernel 25.5.0, which is what the harness records).
Hardhat 3.12.0 is not the current release; 3.16.0 shipped on 7 September 2026. I pinned the version the repository's existing benchmark fixture uses rather than the newest one, which means my Hardhat row carries exactly the defect the rest of this article is about. Recorded, not excused.
Every command was timed whole, from process start to exit, with process.hrtime.bigint() around child_process.execFile. That includes start-up, cache validation, test discovery and reporting, because that is what a developer waits for.
The generator, harness, every individual observation and the scripts that build the figures are in the repository under examples/articles/how-do-i-publish-reproducible-benchmarks-for-open-source-developer-tools.
One sample is not a measurement
Thirty samples per side, two discarded warmups, order alternated, no-change rebuild:
| median | mean | min | max | coefficient of variation | |
|---|---|---|---|---|---|
forge build |
199.8 ms | 194.6 ms | 162.1 ms | 242.1 ms | 12.1% |
hardhat build |
218.1 ms | 231.0 ms | 213.7 ms | 277.2 ms | 8.6% |
Foundry is faster by a median of 18.3 ms, a ratio of 1.09x. A bootstrap over the recorded samples puts the 95% interval for that ratio at 1.05x to 1.24x, so the honest headline is not "9% faster" but "somewhere between 5% and 24% faster, on this workload, on this machine".
The distributions overlap. Drawing one sample from each pool and comparing them — which is what a benchmark with one run per tool does — names Hardhat the faster command in 8.6% of all 900 possible pairs. Three samples a side brings that to 3.3%, nine brings it to 0.2%, and by thirty samples a side not one of the 200,000 draws got it wrong.
That number is not a property of benchmarking in general. On the unit-test workload in the same session, hardhat test ran in a median of 235.6 ms against 325.0 ms for forge test on Foundry 1.5.1 — a 1.38x gap with a 1.32x–1.46x interval — and no single-sample draw out of 900 got the order wrong. Same harness, same machine, ten minutes apart. The spread relative to the effect is what decides how many samples you need, and you only learn that by collecting them.
One more thing the raw samples showed: two warmup runs were not enough. On the unit-test workload the first third of the thirty samples ran at a median of 357.0 ms and the last third at 321.6 ms, a 10% decline inside a single measured run, and Hardhat drifted by the same 10% in the same direction. A harness that reports only a median hides that completely.
More samples cannot fix a shared directory
The comparison that behaved worst was the simplest one to set up: the same forge test --match-path test/Unit.t.sol on Foundry 1.5.1 and 1.8.3, in one checkout, with one out/ and one cache-forge/.
Median 678.6 ms against 452.0 ms, a tidy-looking 1.50x. The bootstrap interval for that ratio runs from 0.41x to 9.85x.
The raw samples explain why. Each release's thirty observations split into two groups of exactly fifteen, separated by a gap wider than either group: 322.7 ms and 1036.6 ms for 1.5.1, 103.5 ms for 1.8.3 and 796.8 ms. The two releases write incompatible build artifacts, so each one invalidated the other's cache and recompiled the project.
The mechanism is the ordering control. Alternating which tool runs first is the standard defence against order bias, and it produces the sequence A B B A A B B A — in which each command follows itself half the time and the other release the other half.

Give each release its own build state and the same commands report 3.13x, with a 3.10x–3.16x interval and coefficients of variation of 3.8% and 9.6%:
FOUNDRY_OUT=tmp/out-151 FOUNDRY_CACHE_PATH=tmp/cache-151 \
  forge test --use "$BENCH_SOLC_PATH" --match-path test/Unit.t.sol
The cross-tool version of this trap is quieter. Foundry's cache_path and Hardhat's paths.cache both default to ./cache, so a project that runs both tools has the two things being compared sharing one state directory by default. Splitting them is two lines:
[profile.default]
src = "src"
test = "test"
out = "out"
cache_path = "cache-forge"
solc = "0.8.25"
evm_version = "cancun"
optimizer = true
optimizer_runs = 200
isolate = true
The part worth internalising is what repetition did and did not buy.
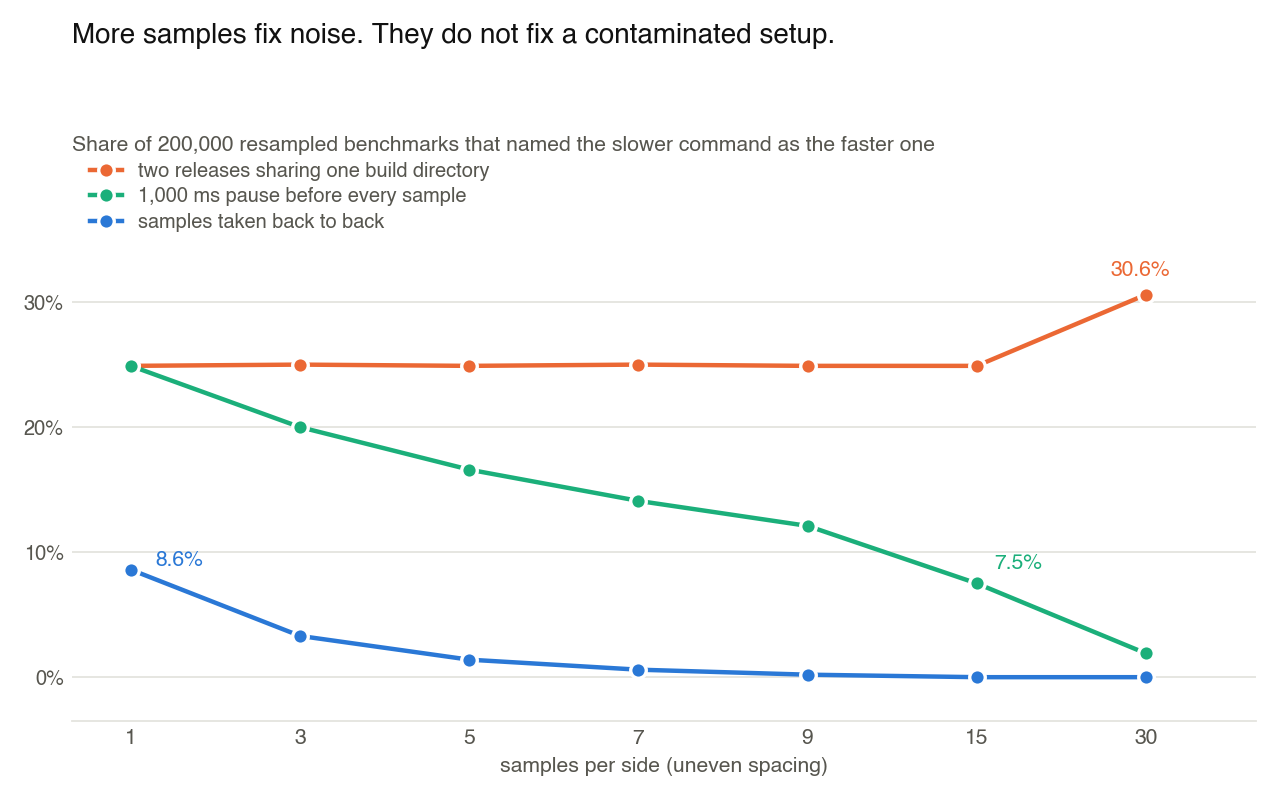
For the back-to-back comparison, sampling works exactly as advertised: the error rate falls with the sample count and vanishes. For the contaminated comparison it does not move. One sample from each pool names the wrong release in 25.0% of all 900 pairs; at thirty samples a side it names the wrong release 30.6% of the time. Averaging a bimodal pool converges on a number that describes neither mode.
"Run it more times" is the advice everyone gives, and it is the advice that does nothing here.
Warmups warm the wrong thing
Discarding the first few runs is the other standard control. It works when the thing that is cold gets warm and stays warm.
Run the same no-change rebuild ten times in a row, in blocks, four blocks per tool, alternating blocks:
| position in block | 1 | 2 | 3 | 4 | 5 | 6 | 7 | 8 | 9 | 10 |
|---|---|---|---|---|---|---|---|---|---|---|
forge build |
204.3 | 167.6 | 167.4 | 161.8 | 162.9 | 163.6 | 160.5 | 162.3 | 159.6 | 160.3 |
hardhat build |
214.5 | 217.3 | 217.8 | 224.4 | 221.8 | 224.4 | 219.1 | 216.4 | 218.5 | 219.8 |
Foundry's first command in each block is 1.26x its own steady state. Hardhat's first command is 0.975x its steady state, which is to say nothing at all. Discarding one warmup per block would fix the Foundry column and leave the Hardhat column alone.
Except that the penalty is not warmup. It is the command that ran before. Holding everything else fixed and changing only what happens immediately before the measured rebuild:
| what ran immediately before | median forge build |
|---|---|
nothing — back-to-back forge build |
159.9 ms |
node -e 0 |
168.0 ms |
hardhat --version |
189.9 ms |
hardhat build |
210.1 ms |
Running the competitor's CLI — not its build, just its version banner — costs the next Foundry command 19%. Running its build costs 31%.
In a block design that penalty lands on one sample and a warmup removes it. In an alternating design every Foundry sample follows a Hardhat command, so there is no warm state to reach: across the thirty measured samples, forge build ran at a median of 166.9 ms when it followed itself and 208.5 ms when it followed Hardhat. Two warmups removed none of it. Hardhat, measured the same way, showed a ratio of 0.998 — the effect is not symmetric, which means the control that was supposed to remove bias introduced 25% of it in one direction.
The gap between samples is a parameter, and nobody publishes it
The node -e 0 row above is 5% slower than back-to-back, and bare Node start-up is not doing 5% of a Foundry rebuild's work. That suggested the variable was time, not work. It is.
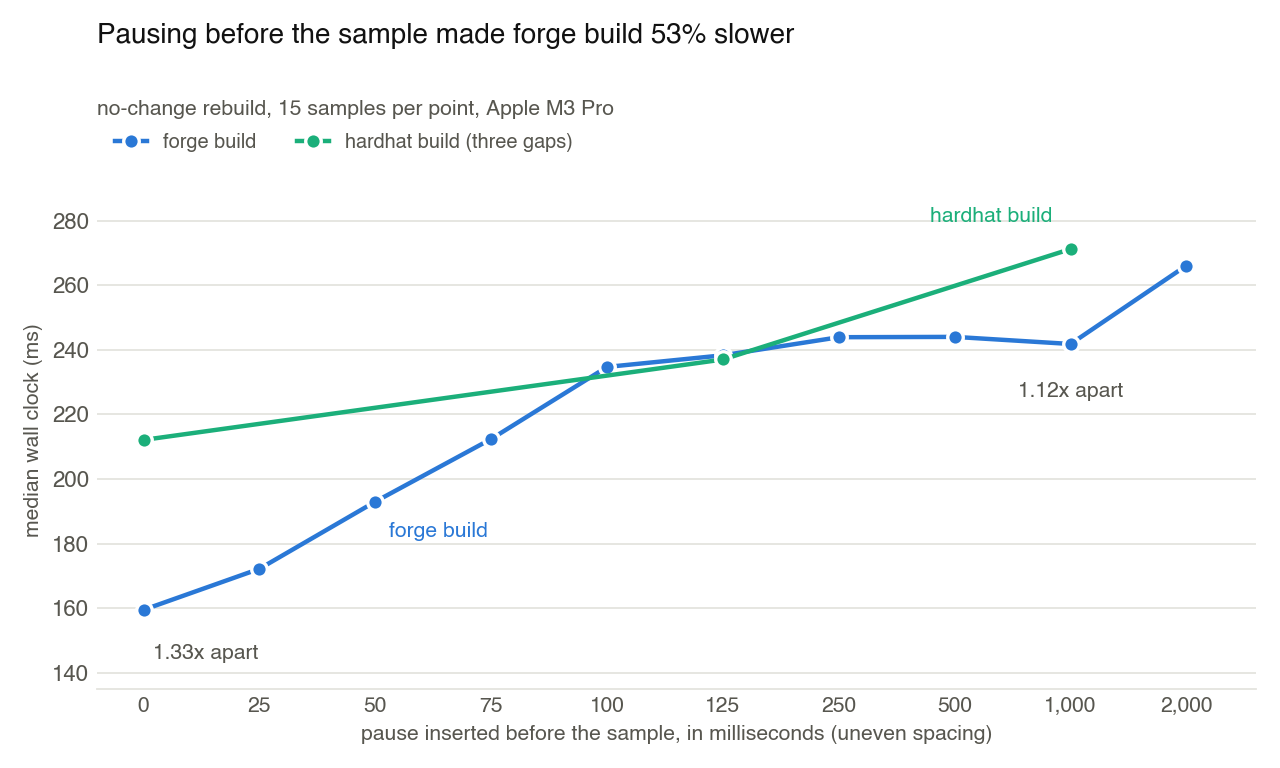
Fifteen samples at each gap. With no pause, forge build takes a median of 159.5 ms. Insert 250 ms of doing nothing before each sample and the identical command takes 243.9 ms — 53% more. The curve climbs between 25 ms and 100 ms and is flat from there. Repeating the whole sweep gave a slightly higher baseline and the same shape: 165.3 ms back-to-back against a 257.8 ms plateau, 56% more.
Elapsed time is not the variable either. Spinning a busy loop for a full second before each sample, instead of idling for one, produced 205.3 ms — most of the penalty disappears when the machine stays occupied.
I did not instrument what the hardware is doing across that boundary. Clock and core-residency state on an Apple M3 Pro is the obvious suspect, and a 100 ms threshold is consistent with it, but "obvious suspect" is not a measurement and I am not going to write it up as one. What I can show is that the effect reproduces, that it is large, and that it changes the comparison rather than shifting it.
Hardhat is much less sensitive to the same pause. Back-to-back, the two commands are 1.33x apart; with a second of idling in front of each, they are 1.12x apart. Running the full head-to-head that way — thirty samples per side, alternated, a one-second pause before every measured command — gives 256.0 ms against 270.3 ms, a ratio of 1.056x with a 95% interval of 1.003x to 1.097x. Sixty measured commands, and the interval all but touches parity.
Background load moves it further. With six CPU workers running, the same rebuild takes 1.21x its quiet-machine median; with twelve, 2.61x.
The advice in Gernot Heiser's systems benchmarking crimes is to "make sure that the system is really quiescent when starting an experiment, leave enough time to ensure all previous data is flushed out." For a benchmark of two long-running systems that is right, and for a benchmark of a command that finishes in 160 ms it costs 53%. The resolution is not to pick a side. It is to state which one you did, because a reader cannot reproduce a number without it, and it is not something I have seen a developer-tool benchmark state.
A version number is not a detail
Both Foundry releases ran the same three workloads on the same commit, each with its own build state:
| workload | Foundry 1.5.1 | Foundry 1.8.3 | 1.5.1 took |
|---|---|---|---|
| cold build, 42 files | 916.0 ms | 812.8 ms | 1.13x |
| no-change rebuild | 185.9 ms | 107.8 ms | 1.72x |
| 120 unit tests | 319.8 ms | 105.1 ms | 3.04x |
An unversioned "Foundry" row in a comparison table is therefore worth between 1.13x and 3.04x of itself, depending on which workload it came from.
It gets more pointed than that. On the unit-test workload, Hardhat 3.12.0 beat Foundry 1.5.1 by 1.38x in this harness. Against Foundry 1.8.3, measured the same way an hour later, Foundry won by 2.27x with a 2.21x–2.36x interval. The ranking reverses across two releases of one tool. My own published benchmark used Foundry 1.5.1; its numbers were real, and its Foundry row now describes an old release. That cuts both ways: the Hardhat 3 rewrite is what made the comparison worth running in the first place, and both projects have shipped since.
The defaults moved too. Read out of an empty project:
forge config |
1.5.1 | 1.8.3 |
|---|---|---|
evm_version |
prague |
osaka |
isolate |
false |
true |
optimizer |
false |
false |
auto_detect_solc |
true |
true |
Foundry's configuration reference still documents prague as the default EVM version, so the binary is the source of truth, not the page. isolate flipping from false to true changes how much gas a test reports and how long a suite takes, which means two people running "the default configuration" a year apart are not running the same benchmark.
The compiler is a separate pin, and pragma solidity ^0.8.0; — which is what most Solidity repositories ship — leaves it open. Compiling one such contract five ways produced four distinct artifacts:
| build | solc | EVM version | deployed bytecode |
|---|---|---|---|
| nothing pinned, 1.5.1 | 0.8.36 | prague | 1,694 bytes |
| nothing pinned, 1.8.3 | 0.8.36 | osaka | 1,694 bytes |
| nothing pinned, 1.5.1, empty compiler cache | 0.8.33 | prague | 1,694 bytes |
| pinned, 1.5.1 | 0.8.25 | cancun | 809 bytes |
| pinned, 1.8.3 | 0.8.25 | cancun | 809 bytes |
The pinned builds are byte-identical across both releases, which is the point of pinning. The unpinned ones are not identical to anything: auto-detection picked the newest compiler this machine happened to have, and the same command with HOME pointed at an empty directory picked 0.8.33, because a release only knows about the compilers that existed when it shipped. A benchmark run on your laptop and a benchmark run on a fresh CI runner compiled different bytecode from the same source, and the unoptimised contract is more than twice the size of the optimised one.
One trap worth naming, because I fell into it while building this. I wrote a second Foundry profile called unpinned to hold the no-pins variant. Foundry profiles inherit from [profile.default], so it quietly kept solc = "0.8.25", evm_version = "cancun" and optimizer = true:
$ FOUNDRY_PROFILE=unpinned forge config
src = "src"
out = "out-unpinned"
evm_version = "cancun"
solc = "0.8.25"
auto_detect_solc = true
optimizer = true
The variant I thought I was measuring did not exist. Configuration variants belong in generated throwaway projects, where what is absent is actually absent.
Equal workloads, or you are timing two different things
Before any of the timing means anything, both sides have to have done the same work. Two checks, both cheap, both worth writing into the harness.
The first is counting. Both tools compiled 42 units from the same sources. forge test --match-path test/Unit.t.sol reported 120 tests passed; hardhat test solidity test/Unit.t.sol reported 120 passing. That part held.
The second is a tripwire. The fixture also contains test/nodejs/tripwire.ts, a TypeScript test whose entire body is assert.equal(1, 2), in a directory named in paths.tests.nodejs. Running the project's whole suite:
$ hardhat test
...
120 passing (120 solidity)
$ echo $?
0
The suite is green, the failing test never ran, and nothing in the output says so. Hardhat 3 makes its TypeScript runner a plugin, and with none registered the test task has one subtask; hardhat test nodejs answers Error HHE1200: Cannot determine a test runner for the following files: nodejs. Building the same project twice under tmp/, once with @nomicfoundation/hardhat-node-test-runner@3.1.0 in plugins and once without, is the whole experiment: without it, exit 0 and 120 passing (120 solidity); with it, exit 1 and Test run failed.
No benchmark I ran was affected by this, because I compared Solidity tests to Solidity tests on purpose. That is exactly why it is worth checking. A missing dev dependency silently removes a test directory from the workload, and a benchmark that counts commands rather than work will report the smaller workload as a faster tool.
The last check is the one I expected to pass and did not. With the same compiler binary, the same optimizer settings and the same EVM version, Foundry's and Hardhat's deployed bytecode for the same contract agree on 766 of 809 bytes and differ in the final 43 — the CBOR metadata suffix, whose hash covers source paths that the two tools name differently. Identical inputs, and the artifacts are still not identical. For a timing benchmark it does not matter. For anything that compares output, it is the difference between a real result and a diff full of noise.
What to publish
The harness writes one manifest.json that is meant to be the deliverable, not a by-product:
{
  "benchmark": "Foundry and Hardhat on one generated Solidity workload",
  "environment": {
    "platform": "darwin 25.5.0 arm64",
    "cpu": "Apple M3 Pro",
    "logicalCpus": 12,
    "node": "v22.17.0",
    "releases": {
      "forge-1.5.1": { "version": "1.5.1-stable", "commit": "b0a9dd9ceda36f63e2326ce530c10e6916f4b8a2" },
      "forge-1.8.3": { "version": "1.8.3", "commit": "cae51ad458f6abb64852b7709eb784352429825d" }
    },
    "hardhat": "3.12.0",
    "solc": "0.8.25+commit.b61c2a91.Darwin.appleclang"
  }
}
Alongside that: a SHA-256 for each of the 63 input files — sources, tests, both config files, the lockfile and the harness scripts themselves — the sampling design written out in words, every command verbatim, every individual observation rather than a summary, and a list of what the benchmark cannot show.
The design field is the one that took me the afternoon to understand is load-bearing:
{
  "warmupsPerCell": 2,
  "samplesPerCell": 30,
  "order": "alternating: iteration i runs [A,B] when i is even, [B,A] when odd",
  "stateIsolation": "each release builds into its own FOUNDRY_OUT and FOUNDRY_CACHE_PATH; Foundry and Hardhat use separate cache directories",
  "clock": "process.hrtime.bigint() around child_process.execFile, whole command including process start-up",
  "machineState": "samples taken back to back; no sleep between samples"
}
Every one of those lines corresponds to a result above where changing it moved the answer.
If you would rather not write a harness, hyperfine does the sampling parts properly: warmup runs, at least ten runs and three seconds per benchmark by default, correction for shell spawning time, and "statistical outlier detection to detect interference from other programs and caching effects" — which is precisely the shared-cache case, flagged rather than averaged away. It cannot check that both sides did equal work, and it cannot pin your compiler.
Heiser's catalogue names the reporting failures directly: "No indication of significance of data", "Missing specification of evaluation platform", "Relative numbers only". Two of those three are solved by publishing the observations rather than the summary.
What I would ask before believing one
After an afternoon of watching one setup produce six answers, this is the list I would want satisfied before I acted on somebody's developer-tool benchmark — starting a migration, choosing a toolchain, quoting a ratio in a comparison table.
- Both tools identified by release and commit, and the compiler or runtime identified by version and hash.
- The workload described precisely enough to regenerate, with evidence that both sides did the same work — counts of files compiled and tests executed, not just command names.
- The state each side was given, and proof that they did not share it.
- Every observation published, not a mean. A bimodal pool is visible in thirty numbers and invisible in one.
- The sampling design, including the gap between samples and whether the order was alternated. Both changed the answer here by more than the difference being reported.
- An interval, not a point. "1.09x" and "between 1.05x and 1.24x" are different claims.
- A statement of what is not equal — the thing the author knows is unfair and measured anyway.
The uncomfortable part is the sixth and seventh items applied to this article. Everything above describes one Apple M3 Pro, on one afternoon, on a workload I generated to be small. The idle-gap result in particular is a property of this hardware that I have not reproduced anywhere else, and the drift inside single runs says the machine was not in the same state at the end as at the start.
Which is the actual answer to the question. A reproducible benchmark is not one that gets the same number twice. It is one that publishes enough for someone else to find out why they got a different one.